When you open Google Analytics, what do you feel? For many people, the answer is “overwhelmed”. There’s a lot of data sitting in those reports, just waiting to be analyzed.
The problem is that those overwhelmed marketers and business owners end up poking around a few default reports, recording some monthly metrics, and leaving until next month.
Line trending up? Celebration dance. Line trending down? Muffled sobs. In either case, return in about 30 days to see if anything has changed.
Going beyond thoseout-of-the-box, default reportsto custom reports, advanced segments and custom dashboards can help accelerate your store’s growth.

Free Reading List: Conversion Optimization for Beginners
Turn more website visitors into customers by getting a crash course in conversion optimization. Access our free, curated list of high-impact articles below.
Get our Conversion Optimization reading list delivered right to your inbox.
Almost there: please enter your email below to gain instant access.
我们也会给你更新新的教育guides and success stories from the Shopify newsletter. We hate SPAM and promise to keep your email address safe.
Feeling less overwhelmed by the data, you can focus on what matters instead of burying your head in the proverbial sand. You can zero in on the insights that’ll drive smarter business decisions faster.
First, what are out-of-the-box reports?
Out-of-the-box reports are those that come to you, well, out of the box. Imagine you’ve just created your Google Analytics account. It’s collecting data and reporting it back to you via a handful of default reports.
 Assuming you didn’tactuallyjust create your Google Analytics account, these default reports will be familiar to you:
- Referral Traffic Report
- Paid Search Traffic Report
- 所有Pages Report
- Events Overview Report
The list goes on and on. Fortunately, these default, out-of-the-box metrics and reports are just the tip of the iceberg. There are a lot of reports, metrics and insights hiding below the surface. All you have to do is look beyond what comes out-of-the-box.
Here’s another way to look at it. When you create a Google Analytics account, the tool doesn’t know what’s important to you, right? You could be running a content site or maybe a SaaS company. It has no way of knowing you’re running an ecommerce store and want to seeecommerce-specific metrics.
That’s why it’s customizable. So you can design the reports that matter to you, so you can monitor the metrics that matter to you, so you can find the insights that matter to you.
If you stick to defaults and out-of-the-box configurations, you’re only getting 30% of what Google Analytics has to offer you.
Introducing Google Analytics custom reports
So, let’s start tapping into that other 70%, shall we? A big part of that is Google Analytics custom reports.
What are Google Analytics custom reports?
A Google Analytics custom report is, quite simply, a Google Analytics report that you create and customize yourself based on your own needs.
You have the freedom to choose the inputs based on the outputs you’re looking for.
That means choosing the dimensions (e.g. country) and the metrics (e.g. pageviews) yourself. Then, choosing how the data is displayed.

How to use Google Analytics custom reports
Before you start creating your own Google Analytics custom reports, there are a few elements of reporting to familiarize yourself with:
- Dimensions: attributes of your data
- Metrics: quantitative measurements
So, here are a few examples of dimensions:
- Country
- Days to Transaction
- Product
- Source / Medium
- Page
And here are a few examples of metrics:
- Pageviews
- Average Price
- Unique Purchases
- Average Order Value
- Product Adds to Cart
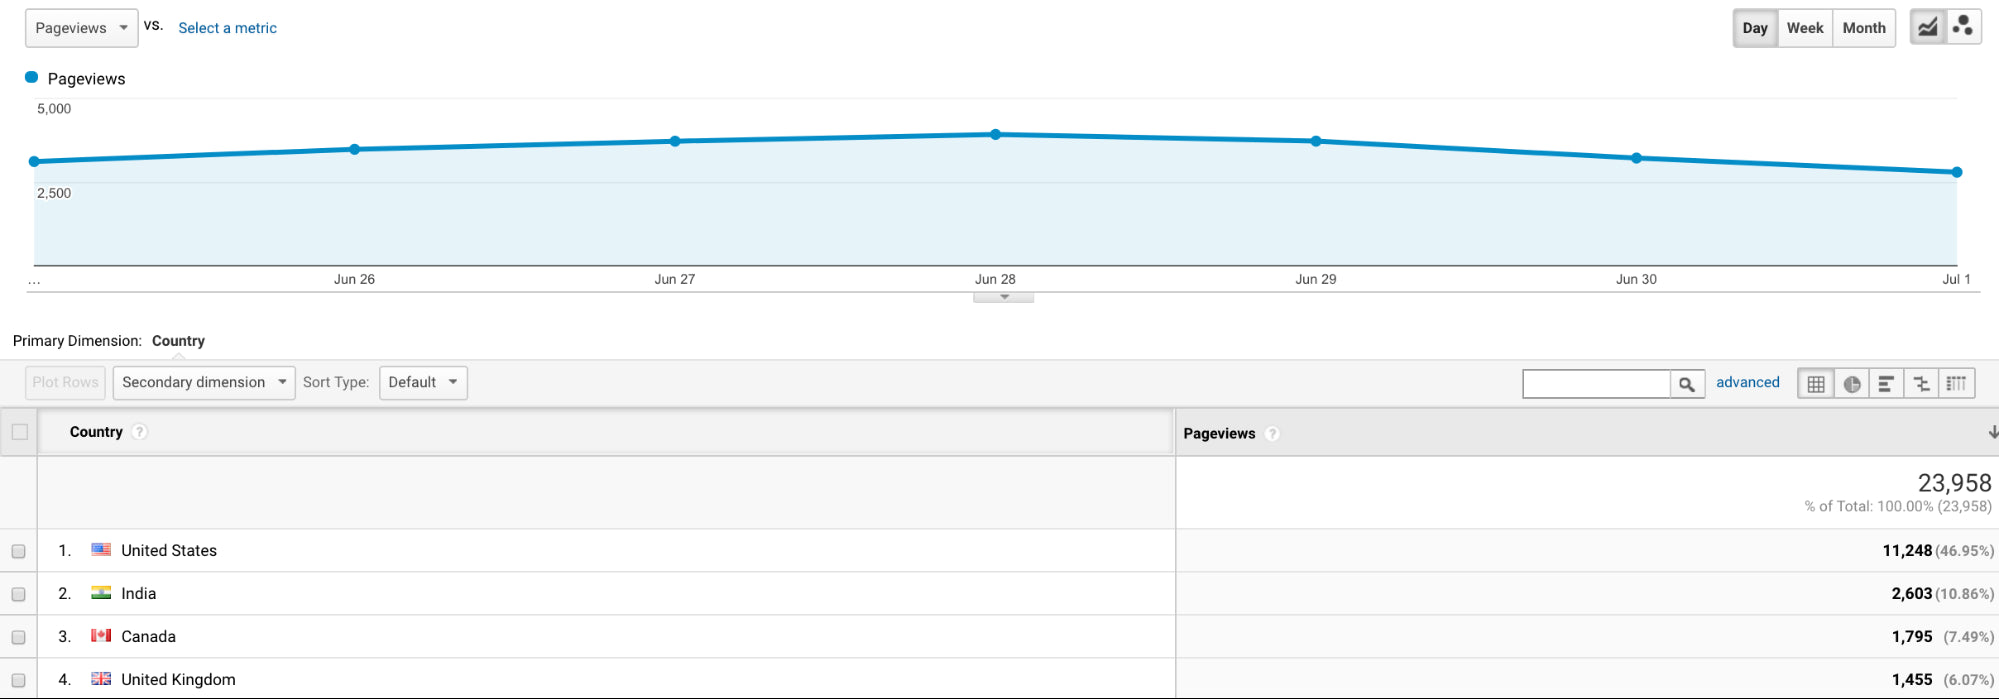
Here’s an easy way to think about this. On a standard Google Analytics report, your dimension values are rows and your metrics are columns. Take a look at this example:

The dimension is “Country” and the metrics are “Pageviews” and “Avg. Order Value”.
If you want, you can add a secondary dimension as well. Then you’ll end up with something that looks like this when you click through to a country (in the example above):

接下来,您将需要了解不同的googlele Analytics reports types:
- Explorer: A line graph and a complete data table with dynamic elements (e.g. search / sort, secondary dimensions). This is the standard report type.
- Flat Table: A simple, static, sortable table that displays your data in rows.
- Map Overlay: A map of the world that uses colors to indicate traffic, engagement, etc.
Now you’re ready to start setting up a custom report yourself. Open up Google Analytics and select Customization -> Custom Reports:

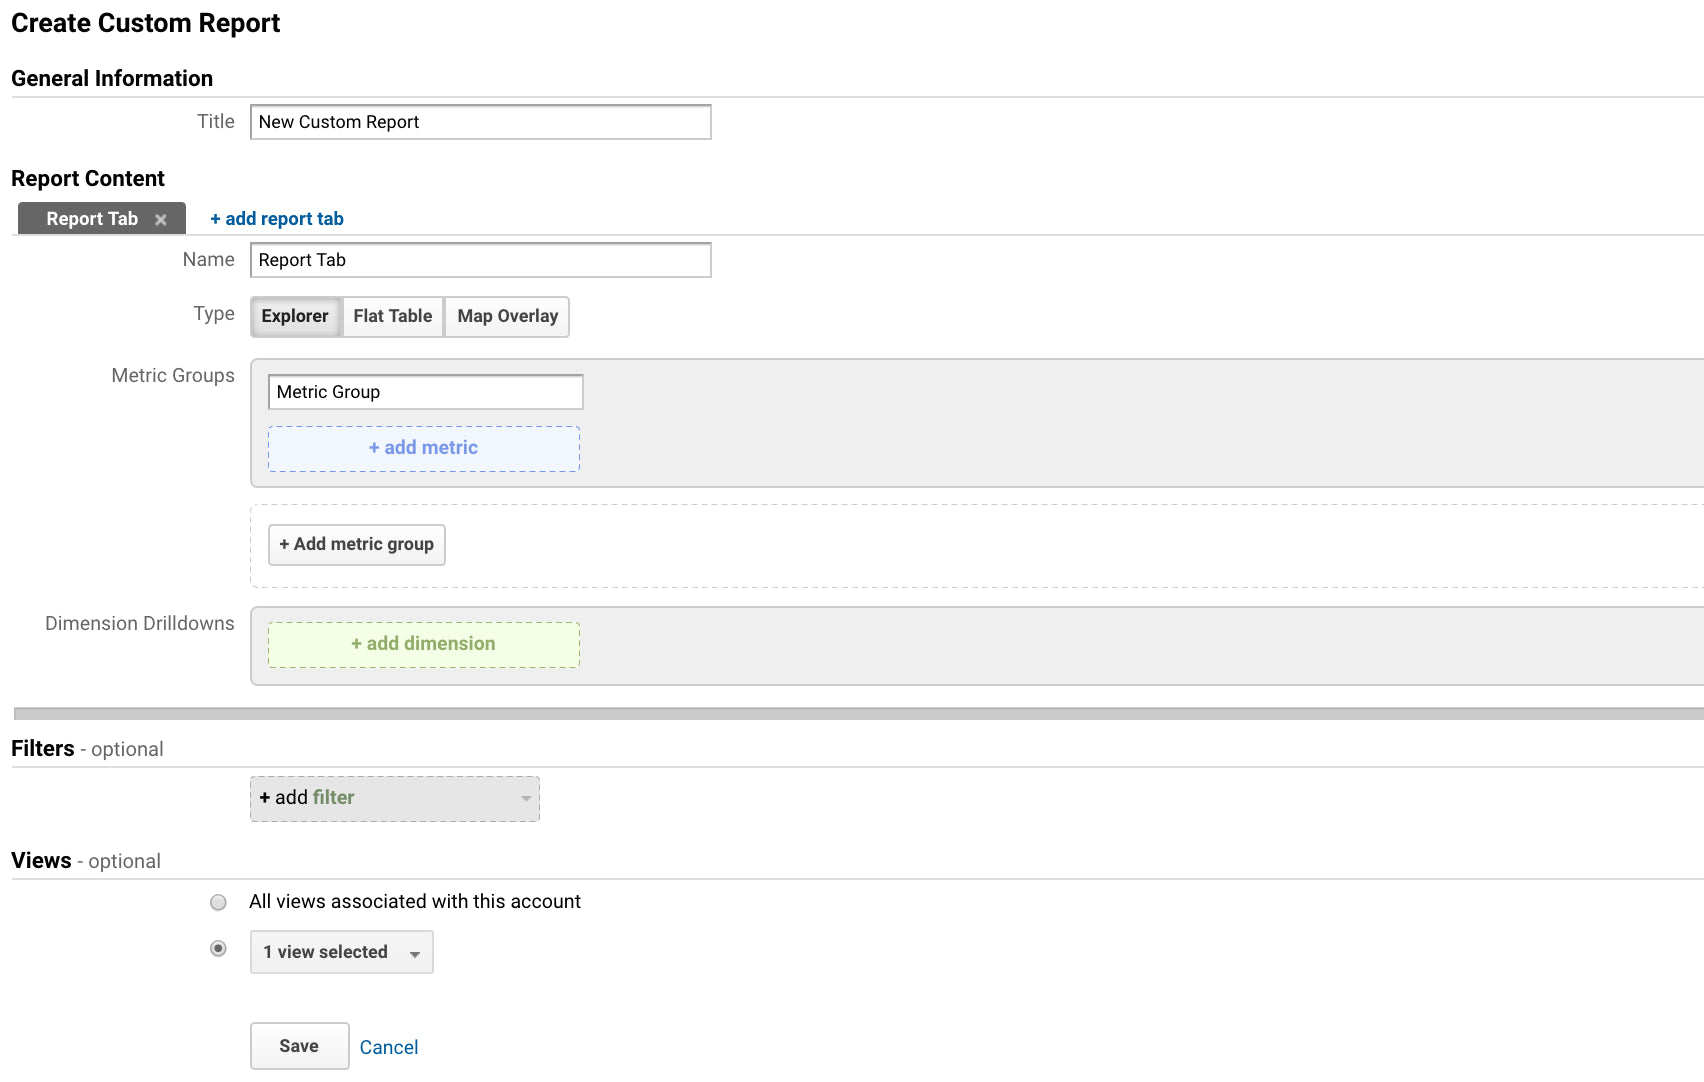
Then click the “+ New Custom Report” button to see this:

Every Google Analytics custom report has one tab by default, but you can add more as you wish. Just keep in mind that the information that follows has to be changed for each tab you create.
Choose your report type, metrics and dimensions as we discussed.
When you get to filters, you can limit the custom report to specific dimensions. For example, if you create a report with the country dimension, you can add a filter to display data from only certain countries. You would use an “Include” filter with an “Exact” match of, say, “Canada”.
The final option relates to your various Google Analytics views. You’re essentially choosing which views can access the report. This is totally up to you and your preferences.
Viola! You’ve got yourself a Google Analytics custom report.
Finding quality custom reports
If you don’t want to create your own Google Analytics custom reports, you can go ahead and borrow some from theGoogle Solutions Gallery, which gives you access to custom reports and advanced segments created by others.

Simply use the filters on the left-hand side to find the asset you want and then click “Import”.
There are a few things to remember here:
- Your goal is to make analysis easier.It’s easy to fall into importing robust reports, which can put you back to square one: overwhelmed with data.
- Acquisition, behavioral and result metrics are a must.Choose custom reports that go end-to-end, that follow the entire funnel.
- Segmentation is everything.As with default Google Analytics reports, you can choose to segment your data in custom reports, which will reveal additional insights. Be sure to take advantage of that.
To get you started, here are some Google Analytics custom reports that you can either import, or re-create and further customize yourself.
Site performance custom reports
Quite simply, if your site doesn’t work, it doesn’t convert. These reports will help ensure your site is performing as expected.
1. Site speed metrics by browser & browser version
This report will help you identify browsers or browser versions with slow load times. You’ll want to pay special attention to the average document interactive time, which is how long before the page is actually usable (regardless of whether it is fully loaded).
Slow sites are a conversion killer.Google and SOASTA recently foundthat speed has a significant impact on bounce rate, so you’ll want to keep a close eye on this report to ensure your store is loading quickly in every browser version.
Alternatively, here’s how you can re-create and customize the report yourself:

2. Ecommerce metrics by browser, browser version & OS
In addition to a slow load time, a low number of transactions or a low conversion rate can also signal a browser-related problem. This report will give you deeper insight into your site’s performance in the browsers your visitors use most often.
If you uncover an issue, eitherconduct cross-browser testingyourself or hand off the information to someone more tech-savvy.
Alternatively, here’s how you can re-create and customize the report yourself:

Tip:Create a report just like this, but instead focus on device type.
3. Metrics by day of week name & hour
Thinking of running a promotion or flash sale? Consider the days and times your store is most active.
This report will show you day of the week and hour of the day data. I recommend customizing the metrics based on what you’re interested in. For example, perhaps you’re more interested inaverage order valuethan average session duration.
Alternatively, here’s how you can re-create and customize the report yourself:

Acquisition custom reports
Acquisition custom reports cover everything from SEO to PPC. Anything that gets potential buyers to your store.
Since PPC is such a large slice of the acquisition pie, I asked Johnathan Dane ofKlientBoostto share his most valuable custom report concepts:
“We’ve found that looking at these metrics helps us understand what PPC levels/buttons make an impact in the future, instead of immediately:
- Attribution.Of course seeing the assist conversions is helpful, but are there certain types of PPC channels that never have last click conversions? If so, explore the potential there without shutting them off.
- AOV.What keywords/audiences/placements bring in a higher AOV than others? With that info, can we afford to pay more per click to increase the volume of those visitors?
- LTV.Do AOV and LTV correlate? Sometimes they don’t, so keep a closer eye on LTV over the span of years to figure out which audiences are ones you can capitalize on.”
Try creating your own Google Analytics custom report based on Johnathan’s recommendations.
4. Organic search referring pages report
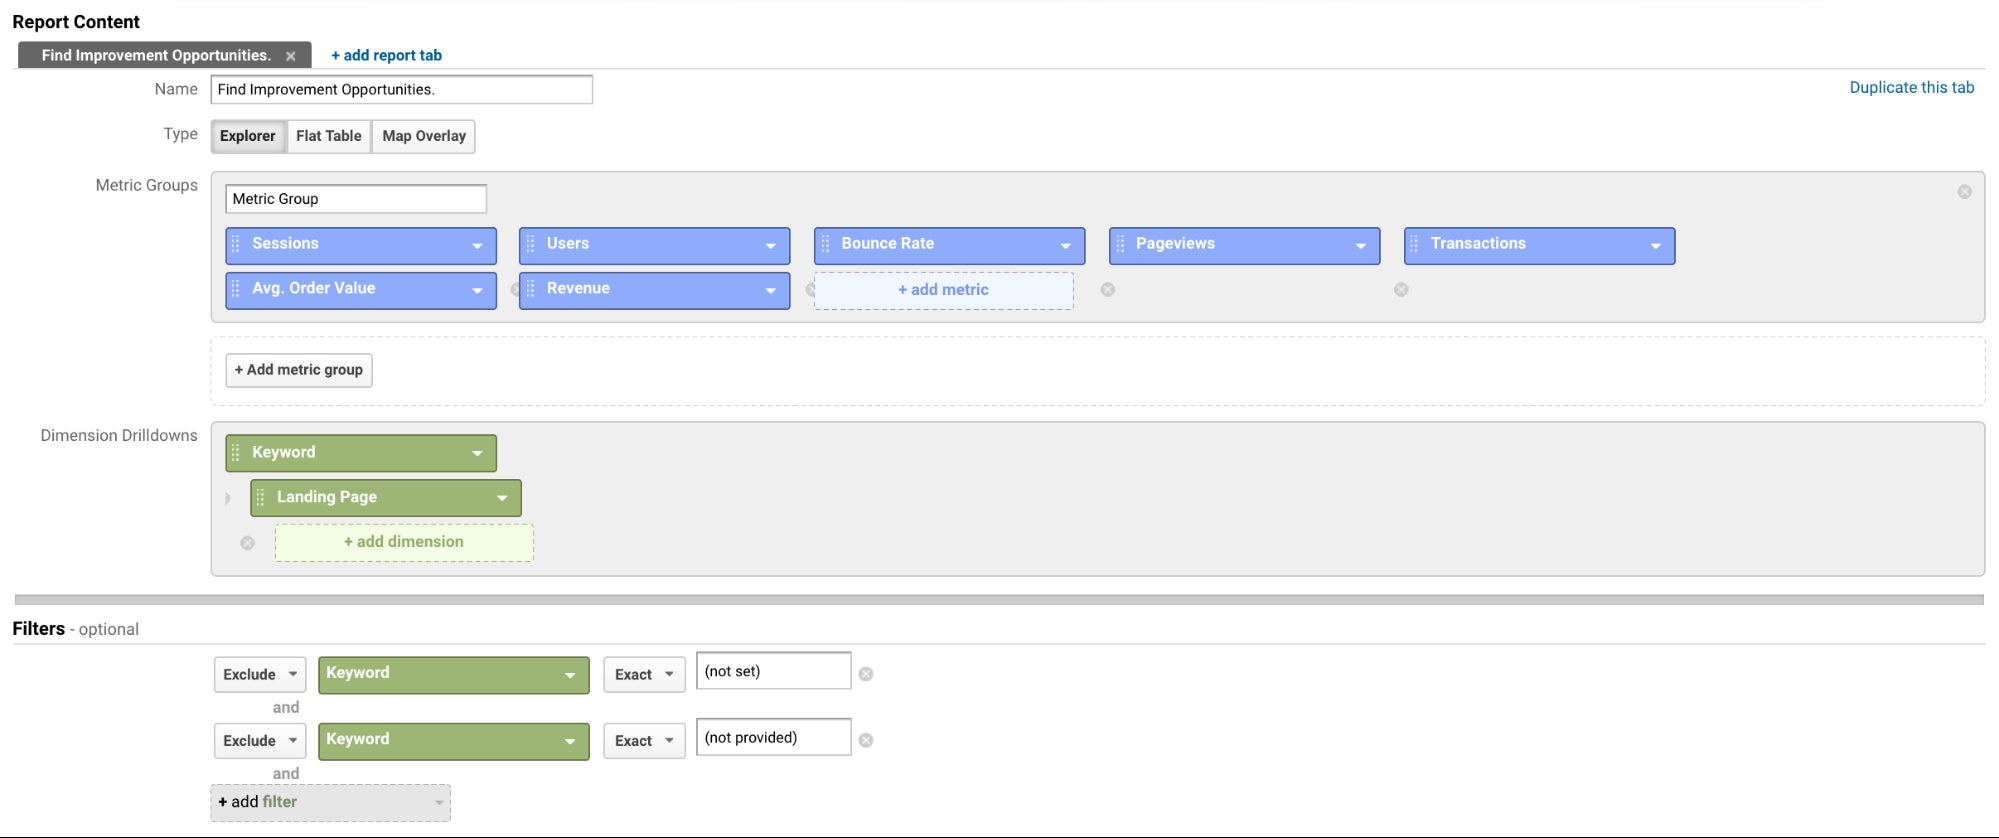
This report will give you a full-funnel look at visitor actions based on search engines, keywords, landing pages, etc. Again, you may want to customize the metrics based on what matters to you the most.
Alternatively, here’s how you can re-create and customize the report yourself:

5. PPC keyword/matched query report
Which queries are being matched to your ads? This report will tell you, giving you insight into which PPC match type (broad, phrase, exact) you should use going forward to keep your ads relevant.
Alternatively, here’s how you can re-create and customize the report yourself:

6. Paid vs. organic search performance
This report is essential for anyone running paid ads. Do you really understand the behavioral differences between your paid and organic search traffic? They interact with your site differently, which means they have different definitions of a good user experience.
You’ll see those behavioral differences and learn more about how to improve the experience for each segment.
Alternatively, here’s how you can re-create and customize the report yourself:

7. Daily ecommerce report
If you’re looking for a single report to visit every day to keep a pulse on your store’s performance, this is it. Justin Cutroni of Google designed it specifically for that very scenario.
Alternatively, here’s how you can re-create and customize the report yourself:

8. All campaigns: cost analysis
Take a look at how much you spent, how often your ad appeared, how many people ended up clicking through to your site, the cost per click, the per session value, etc. Avinash Kaushik designed this custom report to make marketers think aboutcostand true ROI.
It’s a very powerful report, but make sure your data is flowing in properly.
Alternatively, here’s how you can re-create and customize the report yourself:

Sales custom reports
Before we jump into Google Analytics custom reports that can help you track sales, be sure you have Enhanced Ecommerce enabled. William Harris ofElumyntexplains:
“One of the things that always surprises me is the lack of Shopify merchants that have turned on Enhanced Ecommerce in their Google Analytics accounts. It's quite literally as simple as clicking a couple of buttons.
Where this really gets fun is if you've set up product type and vendor effectively in your store, you'll be able to drill down into which product types (called product categories in Google Analytics) are growing, which ones are shrinking, and even which ones are selling the most by channel (organic, paid, email, etc.) by adding a secondary dimension.”
9. Business outcomes analysis
With Enhanced Ecommerce enabled and ready to rock, you’re all set to try out this custom report.
It’ll give you access to a ton of business outcome data in an efficient way.
So, you’ll still be pulling out big insights about revenue, checkouts, average order value, etc. You just won’t be spending hours sifting through report after report.
Note that there’s a “Non-Ecommerce Analysis” tab to this report. You can easily just remove that tab in the “Edit” panel.
Alternatively, here’s how you can re-create and customize the report yourself:

Haven't created a store yet?
Start your free trial of Shopify—no credit card required!
谷歌分析定制报表常见问题解答
What are custom reports in Google Analytics?
How do I create a custom Google Analytics report?
- Log into your Google Analytics account and select the property you wish to create a custom report for.
- From the left-hand side menu, select “Customization” and then “+New Custom Report”.
- Add a title, description and select the metrics and dimensions that you want to include in the report.
- Click “Save” and your custom report will be available from the “Customization” menu.
How many types of custom reports are there in Google Analytics?
What actions can custom reports perform?
- Generate summaries and visualizations of data.
- Create custom calculations and metrics.
- Identify correlations between data points.
- Filter data based on specific criteria.
- 比较数据点。
- Track changes in data over time.
- Measure performance against goals.
- Create segmentations and groupings of data.
- Monitor trends and outliers in data.
- Produce reports in a variety of formats.


